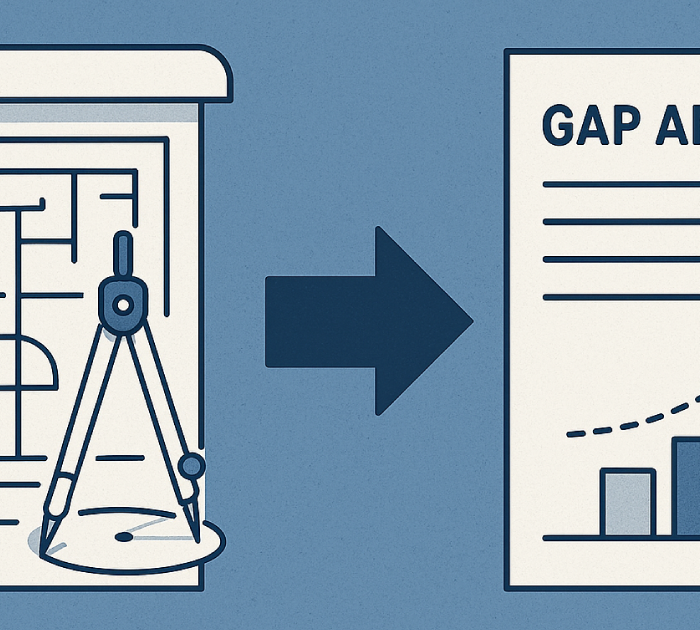
If your business data feels like a never-ending buffet you can’t possibly finish—relax, you’re not alone. Many SMBs collect oceans of data: sales figures, customer feedback, web analytics, inventory logs…the list goes on. The challenge? Actually digesting all that information and transforming it into something useful. Because let’s be honest: spreadsheets don’t pay the bills unless you know what to do with them with insights.
Why Data Overload Happens
Modern businesses have access to more data sources than ever before. While that sounds great, too much data can create confusion. Without a proper system to analyze and prioritize information, you may find yourself drowning in numbers without a lifeboat.
Quality Over Quantity
It’s easy to assume that more data is always better. In reality, what you need is relevant data. Focus on metrics that align with your business goals. If customer retention is your top priority, track repeat purchases and satisfaction scores. If efficiency is your concern, watch production lead times and error rates. By filtering out the noise, you transform an overwhelming torrent into a manageable stream.
Data Analytics and insight Tools: Your Translators
Just like you wouldn’t read War and Peace in binary, you shouldn’t rely on raw data streams alone. Invest in user-friendly data analytics tools—dashboards, visualization software, or integrated ERP modules. These tools translate complex datasets into colorful graphs and charts that let you instantly see what’s up and what’s down. If you can tell at a glance that your sales are up 10% this quarter, you’ve got something you can work with.
Turning Insights into Actionable Steps
Data insights are only valuable if they prompt action. Let’s say the data reveals that a certain product line sells better online than in-store. That might mean you should beef up your e-commerce presence or explore online-exclusive promotions. Or, if you find that customers consistently abandon their carts at the shipping cost stage, consider adjusting your pricing or offering free shipping for bulk orders.
Engage Your Team in the Process
Your employees are the boots on the ground. They’ll know if certain actions suggested by the data are feasible or if there’s a simpler solution. Share insights with your team in a digestible format and invite feedback. By making them active participants rather than passive recipients, you’ll get more practical ideas and encourage a culture of continuous improvement.
Invest in Training
Even the best analytics tools won’t help if nobody knows how to use them. Provide training sessions or quick reference guides. Consider designating “data champions” within each department—people who can troubleshoot issues and mentor colleagues. Over time, the fear of complicated charts will vanish, and employees will confidently navigate the data landscape.
Avoid Analysis Paralysis
Sometimes, the more you know, the harder it is to make a decision. This is the dreaded “analysis paralysis.” To combat it, set time limits for decision-making. For example, if you notice a trend—like a drop in customer satisfaction—don’t wait for another three months of data to confirm it. Take a small, calculated step to address the issue. If it doesn’t help, you can always pivot later.
Celebrate Data-Driven Wins
Data can reveal successes, not just problems. Maybe you notice that a new marketing campaign doubled your leads, or a tweak to your packaging cut return rates in half. Celebrate these victories publicly. When your team sees that data-driven decisions lead to tangible improvements, they’ll be more motivated to keep using insights to guide their efforts.
A Continuous Improvement Mindset
Data analysis is not a one-and-done deal. Markets shift, consumer preferences evolve, and internal processes change. By regularly reviewing your data and taking incremental actions, you create a cycle of continuous improvement. Over time, this consistent fine-tuning will give your SMB a competitive edge that’s hard to beat.
Making Data Your Ally
Instead of viewing data as an overwhelming chore, see it as a conversation with your business. It’s telling you what works, what doesn’t, and where you can improve. Listen closely, respond thoughtfully, and you’ll transform heaps of confusing stats into a powerful roadmap for growth.
Focus on relevant metrics aligned with your goals and use analytics tools to visualize data, making it easier to understand and act upon.
Treat them as learning opportunities. Adjust your strategy, test new approaches, and use data to refine your decisions continually.
Involve them early, provide training, and celebrate successes. Show them that data-driven decisions make their jobs easier and more effective.


